Over the past few weeks I’ve had the pleasure of working with Dion Almaer on a Browser Memory Tool Prototype. This has been a lot of fun for me; for one thing, I’ve always wanted to help developers diagnose the problem of “I’ve been running my web app/Firefox extension for 8 hours, why’s it taking up 800 megabytes of RAM?”. And I’ve also always wanted to have an excuse to learn about the internals of SpiderMonkey, Mozilla’s JavaScript engine, and play with its C API. So working on this tool has helped me kill two birds with one stone.
The architecture we decided to use for the memory tool was particularly fun to design and implement. Because much of Firefox itself is implemented in JavaScript, we need to freeze the whole application in order to profile its memory use. The problem with this, though, is that being barred from using JS to implement the memory profiler itself would be a bummer—especially considering that we didn’t know the problem domain terribly well and would therefore need the freedom to easily experiment to find the best solution.
Fortunately, it turns out that SpiderMonkey was designed to support multiple instances of what’s called a JavaScript Runtime. From the JSAPI User Guide:
A JSRuntime, or runtime, is the space in which the JavaScript variables, objects, scripts, and contexts used by your application are allocated. Every JSContext and every object in an application lives within a JSRuntime. They cannot travel to other runtimes or be shared across runtimes. Most applications only need one runtime.
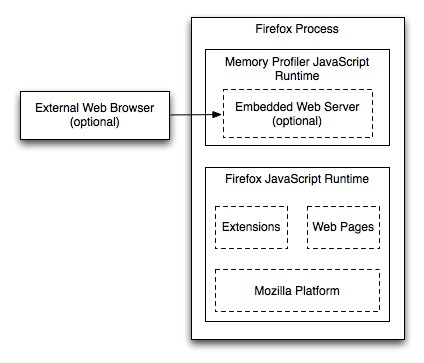
All the JavaScript code in Firefox—whether it belongs to the Mozilla platform, an extension, or a web page—executes in the same runtime. We’ll call that runtime the “Firefox runtime”. The trick to implementing a memory profiler in JavaScript itself was just to “freeze” the Firefox runtime and create a new runtime, which we’ll call the “memory profiling runtime”, to peek into the Firefox runtime via a simple API. We also added a simple blocking socket object to the memory profiling runtime, which allows it to embed a web server that a separate process could connect to—in this case, the cool Memory Tool Ajax Application that Dion made.
Since Dion and I were really the only ones writing code for the memory profiling runtime, we haven’t actually documented the API yet. It’s pretty simple, though; every object in the Firefox runtime is referred to by a unique integer ID, and various functions can be used to get metadata about an object. For instance, getObjectInfo(id) returns a JSON-able data structure containing information about the object with the given ID, such as its prototype, its parent (i.e., its global scope), what other objects it points to, and so forth. Dion then used this API to write a memory profiler server.
One nice thing about the memory profiling runtime, though, is that it doesn’t have to embed a web server: it could just get some information about the heap and return it as a JSON object to the Firefox runtime, which could then do something useful with it. There’s lots of interesting things we’d like to eventually see—for instance, a visualization of the JS heap over time would be pretty cool.
Of course, we also ran into our own share of problems, many of which we’re still trying to resolve. They’re pretty technical in nature, but you’re welcome to read the write-up on our Memory Profiling Notes from July 2009 on the wiki.
Creating this tool wouldn’t have been possible without the excellent SpiderMonkey documentation on the Mozilla Developer Center or the friendly folks on #jsapi at irc.mozilla.org—particularly David Baron and Blake Kaplan. I’m definitely looking forward to tinkering more with the JSAPI in the future, and working with Dion and Ben to make developing for the Open Web a lot more fun.
Update: I’ve since documented the API for the memory profiling binary component and runtime.