Back in July, the Mozilla Developer Tools Lab released an experimental memory tool that allowed a web developer to get a better picture of Firefox’s memory usage. That tool was a great start, but it had a few issues:
- It was slow.
- It showed the entire Firefox JS heap, which included lots of objects internal to Firefox that weren't of much use to web developers.
- It was a bit of a hassle to set up, as it involved freezing Firefox and accessing a local web server from a different browser.
I’ve spent some time trying to resolve these issues, and have a usable prototype for Firefox 3.5 that you can try out. The new tool has an entirely different front-end from the last one and runs in Firefox itself—no need to launch a separate browser. It also runs a lot faster, and allows you to profile the JavaScript memory use of individual browser tabs.
Here’s a screenshot. You can also click on it to read some annotations I’ve added through Flickr:
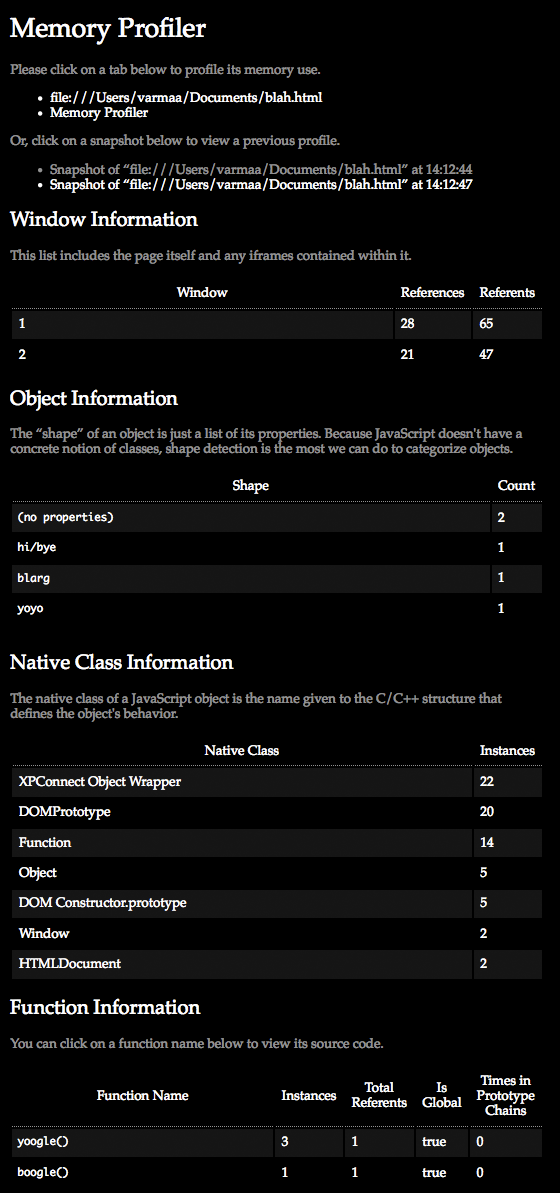
The above profile was taken while this page was open in a tab. Feel free to look at the page’s source code and compare it with the profiling output.
One of the first things you’ll notice is that there’s no information about actual bytes used. This is partly because we need to add more instrumentation to Firefox in order to get you really accurate information about that—something that’s currently being done with the advent of about:memory. But it’s also because raw byte counts aren’t necessarily helpful in debugging memory leaks in web applications: what’s really useful is information about what kinds of objects are staying in the page, which this new iteration of the memory tool tries to provide.
If you’re interested in learning how the tool works or hacking on the code, check out the wiki page and my Fun with SpiderMonkey blog post.
What I’m really interested in knowing is: do web developers find this useful? What could be added to it to make it more useful in diagnosing the memory use of a web application? If you’re a web developer, please download the addon, choose “Memory Profiler” from the “Tools” menu in Firefox, and let us know what you think!